
Stock market evolution
Stock markets and the evolution of Viscofan
In 2025, the global economy has shown remarkable resilience despite the context of geopolitical tensions and new trade frictions.
The global economy grew by around 3.3%, a similar pace to that of 2024 according to estimates from the International Monetary Fund, supported by a context of moderating inflation in which several central banks began cutting interest rates, which contributed to easing financial conditions, the strength of consumption in the United States, the boost from investment linked to artificial intelligence and the gradual recovery of international trade.
In monetary policy, the major central banks have shifted their monetary policies toward normalization. The Federal Reserve resumed interest rate cuts after observing a stabilization of inflation and signs of moderation in the labor market, while the European Central Bank implemented three consecutive cuts before pausing its roadmap to assess the evolving macroeconomic environment.
In the currency markets, the significant depreciation of the dollar against the euro stands out, reversing the strength of previous years. This movement has responded to investment flows into Europe in an environment of greater risk appetite, the uncertainty stemming from the new US trade policy, and the narrowing of the interest rate differential following the Fed and ECB cuts.
In the stock markets, 2025 was an exceptional year, with widespread gains across most global exchanges, fueled by falling inflation, more accommodative monetary policies, and improved investor sentiment. Europe stood out in particular, and Spain especially, which was one of the strongest performing markets globally, with the IBEX 35 showing strong performance largely driven by the banking sector. Against this backdrop, the Euro Stoxx 600 rose 16.7% in 2025, the IBEX 35 gained 49.3%, and the German DAX climbed 23.0%. In the United States, the S&P 500 registered a 16.4% increase.
However, not all sectors followed this trend. Activities such as food and beverages have lagged behind in an environment of uncertainty marked by persistent food price inflation and its impact on consumption. Specifically, the European Euro Stoxx Food & Beverage index, of which Viscofan is a part, has fallen by 1.8% in 2025.
Viscofan's share price closed the year at €53.40, a decrease of 12.5%, or 7.2% including dividends paid. The stock's performance was negatively impacted by the depreciation of the US dollar against the euro on the Group's financial results, and by allegations made by a digital media outlet regarding environmental practices at the Danville plant in Illinois, USA (See section ESRS E2 - Pollution, subsection 2.2.1. Management of incidents, risks and opportunities in the Consolidated Non-Financial Information Statement and Sustainability Report).
The average daily share price this year has been €59.47 and the market capitalization amounts to €2,483 million at year-end 2025.
Also, throughout the year, 16.6 million shares of Viscofan have been traded on the Spanish continuous market, with a total traded volume of €963 million, equivalent to a daily average of €3.8 million.
Euro Stoxx600, Stoxx Food & Beverage and Viscofan in 2025
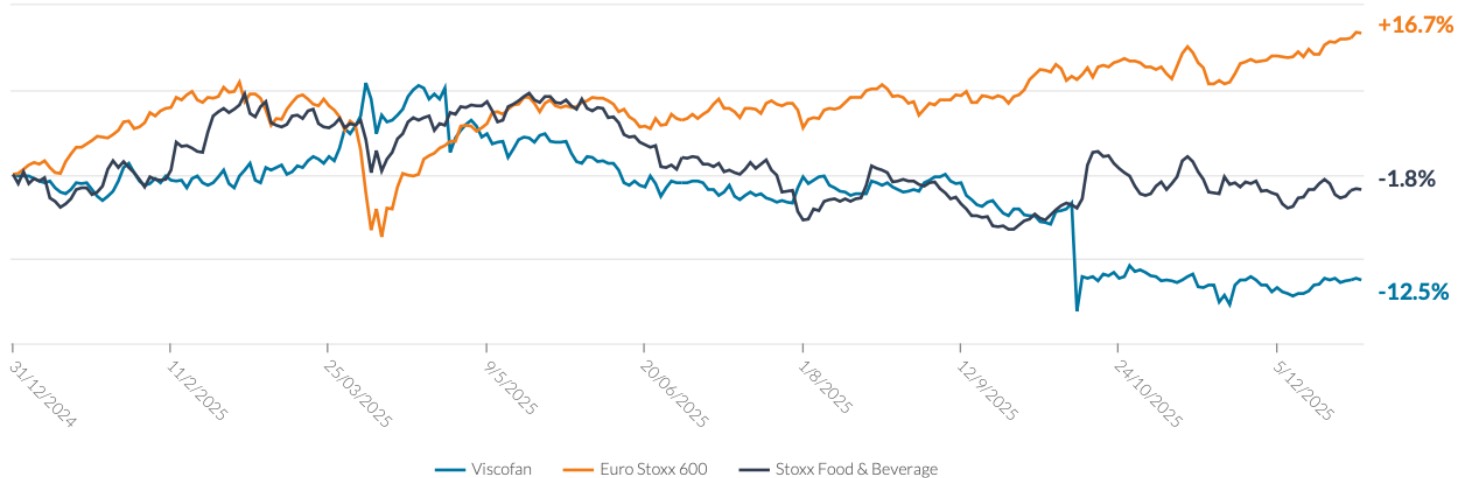
*Chart based on 100 as at December 31, 2024
Viscofan's stock
Viscofan's share capital consists of 46,500,000 shares, with a nominal value of €0.70 each, belonging to the same class and fully paid up.
The stock is listed on the Spanish stock exchanges and has been part of the continuous market since its initial public offering in December 1986.
Viscofan is included in the Madrid Stock Exchange General Index (IGBM), within the Consumer Goods segment and the Food subsector, as well as in the Ibex Mid Cap. At the European level, it is part of the Euro Stoxx Food and Beverage and Stoxx Europe 600 indices.
It is also part of the IBEX ESG, an index promoted by Bolsas y Mercados Españoles to boost sustainable investment.
Shareholder remuneration
Throughout its various strategic plans, the Viscofan Group has built a solid and flexible business model. This characteristic leads to the creation of cash flows that allow for investment projects to be carried out to improve value creation, which is shared with shareholders through dividends, while simultaneously maintaining a strong balance sheet structure.
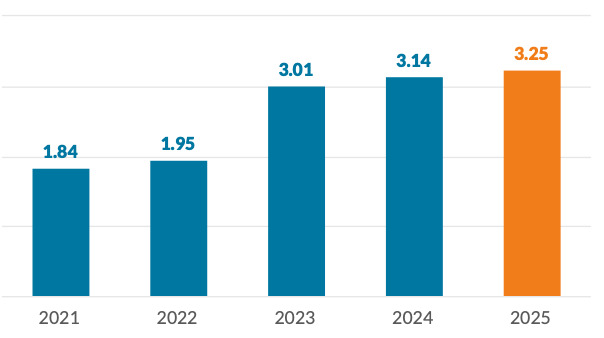
The Board of Directors has agreed to propose a distribution of profits equivalent to a remuneration of €3.25 per share to the General Shareholders' Meeting, this is 3.5% up on the previous year and 76.6% higher compared to 2021 (the year preceding the launch of the Beyond25 plan) driven by a generation of operating cash flows higher than those foreseen in the strategic plan.
Thus, shareholder remuneration is composed of:
- The interim dividend of €1.483 per share (paid on December 17, 2025).
- The proposal for a supplementary ordinary dividend of €0.757 and an extraordinary dividend of €1.00 per share within the framework of the optional dividend system in cash or shares "Viscofan Flexible Remuneration" in a single payment expected in June 2026.
- The attendance bonus for the General Shareholders' Meeting is €0.01 per share.
The Board of Directors has approved submitting to the General Shareholders' Meeting the possibility of flexible shareholder remuneration, allowing shareholders to choose between receiving new shares through a bonus share issue or cash payment. To avoid dilution for shareholders who do not participate in the bonus share issue, the Board plans to cancel the treasury shares necessary to maintain a stable number of shares outstanding.
Additionally, on November 25, 2025, Viscofan launched a share buyback program, valid until February 27, 2026, under which the number of shares to be acquired could not exceed 500,000, representing 1.075% of the Company's share capital. As at December 2025, €7.6 million had been allocated and 143,548 shares had been acquired.
Dividend per share. In euros
Viscofan, its shareholders and the investment community
Through its Investor Relations, Communications, and Sustainability Department, Viscofan maintains a firm commitment to transparency, accessibility, and the disclosure of relevant information, both financial and non-financial. The aim is to facilitate a complete and thorough understanding of the company, its strategy, and its operational development.
To guarantee this flow of information and provide certainty to shareholders, the market and other stakeholders regarding the transparency of information and access to it, Viscofan has a communication policy with shareholders, institutional investors, proxy advisors and economic-financial, non-financial and corporate information, defined in accordance with good practices and good governance recommendations applicable to listed companies.
Communication channels
The Group maintains a network of channels for dialogue with the financial community, including:
- Presentations at industry seminars and events.
- Roadshows with institutional investors, organized by the company or by financial intermediaries.
- Presentation of results and holding of the General Shareholders' Meeting.
- Scheduled visits to the headquarters.
- Telephone and email dedicated exclusively to serving shareholders and investors.
- Continuous publication of relevant information through the CNMV.
Also, the information published on the website www.viscofan.com:
- In the Investor Relations section, Viscofan publishes the latest news, reports and quarterly results presentations, annual report, stock price evolution, and other information of interest.
- The Sustainability section details information on Viscofan's main commitments to the Sustainable Development Goals; sustainability indicators; and the 2030 commitments set out in the Group's Sustainability Action Plan.
- In the Corporate Governance section, Viscofan publishes information regarding the Board of Directors, Committees, Policies and Regulations, and other related information of interest.
Viscofan also maintains close communication with the financial markets, with a total of 15 national and international analysis companies covering the company by the end of 2025.
Two-way communication is important, since the questions and concerns of the financial community are taken into account and transmitted within the company, issues at the financial, strategic, sustainability and corporate governance levels.
In 2025, the most frequently asked questions have been related to the impact of the depreciation of the US dollar against the euro, the evolution of wrap volumes and prices, sales of new businesses, inflation of collagen skins, the accusations received at the Danville plant, the acquisition of the Pet Mania company in Brazil, and shareholder remuneration, among others.
Evolution of the main stock market data
| Period Beyond25 |
Period MORE TO BE |
|||||||||
| Share price € | 2025 | 2024 | 2023 | 2022 | 2021 | 2020 | 2019 | 2018 | 2017 | 2016 |
| Closing | 53.40 | 61.00 | 53.60 | 60.20 | 56.90 | 58.05 | 47.10 | 48.12 | 55.01 | 46.85 |
| Maximum for the year | 68.70 | 64.40 | 68.85 | 63.65 | 61.45 | 64.35 | 56.55 | 66.20 | 56.33 | 56.06 |
| Minimum in the year | 48.35 | 51.70 | 51.60 | 48.92 | 53.25 | 43.28 | 40.12 | 46.20 | 46.75 | 41.84 |
| Evolution of Viscofan in the continuous market | Closing 2025 | Closing 2024 | Closing 2023 | Closing 2022 | Closing 2021 | Closing 2020 | Closing 2019 | Closing 2018 | Closing 2017 | Closing 2016 |
| % Annual Variation Viscofan | -12.5% | 13.8% | -11.0% | 5.8% | -2.0% | 23.2% | -2.1% | -12.5% | 17.4% | -15.8% |
| % Annual Change IGBM | 50.1% | 14.1% | 21.6% | -4.8% | 7.1% | -15.4% | 10.2% | -15.0% | 7.6% | -2.2% |
| % Annual Change IBEX 35 | 49.3% | 14.8% | 22.8% | -5.6% | 7.9% | -15.5% | 11.8% | -15.0% | 7.4% | -2.0% |
| % Annual Change Euro STOXX 600 | 16.7% | 6.0% | 12.7% | -12.9% | 22.2% | -4.0% | 23.2% | -13.2% | 7.7% | -1.2% |
| Annual % Change IBEX Medium Cap | 16.1% | 11.7% | 5.9% | -7.4% | 8.6% | -9.7% | 8.4% | -13.7% | 4.0% | -6.6% |
| % Annual Change in the Food and Beverage Sub-Sector IGBM | -2.6% | 11.4% | -3.2% | -0.7% | -1.6% | 10.6% | 1.8% | -8.4% | 5.2% | -5.4% |
| Stock market trading data | 2025 | 2024 | 2023 | 2022 | 2021 | 2020 | 2019 | 2018 | 2017 | 2016 |
| Capitalization at year-end (Mn €) | 2,483.1 | 2,836.5 | 2,492.4 | 2,799.3 | 2,645.9 | 2,699.3 | 2,190.2 | 2,242.6 | 2,563.7 | 2,183.4 |
| Cash traded on the continuous market (Mn €) | 963.1 | 611.6 | 663.0 | 763.3 | 1,135.8 | 1,561.8 | 1,230.5 | 1,669.1 | 1,995.2 | 2,707.1 |
| Average per session (Mn €) | 3.8 | 2.4 | 2.6 | 3.0 | 4.4 | 6.1 | 4.8 | 6.5 | 7.8 | 10.5 |
| Traded shares | 16,637,542 | 10,347,687 | 10,946,556 | 13,893,544 | 19,626,412 | 28,338,888 | 25,815,115 | 29,807,220 | 38,658,041 | 54,701,597 |
| Average number of shares traded per session | 65,245 | 40,739 | 42,760 | 54,060 | 76,666 | 110,268 | 101,236 | 116,891 | 151,600 | 212,022 |
| Per share ratios | Closing 2025 | Closing 2024 | Closing 2023 | Closing 2022 | Closing 2021 | Closing 2020 | Closing 2019 | Closing 2018 | Closing 2017 | Closing 2016 |
| Shares admitted to trading | 46,500,000 | 46,500,000 | 46,500,000 | 46,500,000 | 46,500,000 | 46,500,000 | 46,500,000 | 46,603,682 | 46,603,682 | 46,603,682 |
| Basic profit per share | 3.50 | 3.45 | 3.05 | 3.02 | 2.87 | 2.63 | 2.27 | 2.66 | 2.62 | 2.68 |
| Return per share | 3.25 | 3.14 | 3.01 | 1.95 | 1.84 | 1.70 | 1.62 | 1.60 | 1.55 | 1.45 |